
Rumina
Data Analyst
As a seasoned Data Analyst in London, I excel at leveraging data to drive business growth in the dynamic tech industry. With expertise in SQL, Python, and advanced data visualization tools, I transform complex data into actionable insights. I empower tech companies to harness data for innovation and success, focusing on optimizing operations, identifying trends, and uncovering opportunities. I am dedicated to helping organizations achieve their strategic goals through data analytics.
Sales Dashboard
Power BI Retail Sales Dashboard Built interactive dashboards to analyze sales across product categories, tracking key metrics like revenue, orders, returns, and customers. Used KPIs and trend analysis to identify growth patterns, customer segments, and top-performing products.


Vacation Planing Project
This project started with a team of six building an interactive Power BI dashboard for vacation planning. Travel data was collected from multiple websites and organized in Excel, where it was cleaned and transformed using tools like VLOOKUP and other data-cleaning techniques. The final dataset was then visualized in Power BI to provide clear insights that help users explore and plan vacations more effectively.
SQL Layoffs in Companies
This portfolio project analyzes global company layoffs using SQL to identify trends by company, location, industry, and year. It also explores companies with 100% layoffs and examines their funding before closing. Techniques such as rolling totals and ranking highlight major layoff patterns and the most affected companies over time.

Python world population

I conducted data cleaning on the world population dataset using Pandas. This process involved identifying and addressing missing values, duplicates, and inconsistencies within the data. I standardized column names for better readability and ensured that the data types were appropriate for analysis. Additionally, I filtered out irrelevant entries to focus on the most pertinent information. This cleaning process enhanced the dataset's quality, making it ready for further analysis.
Customer Churn
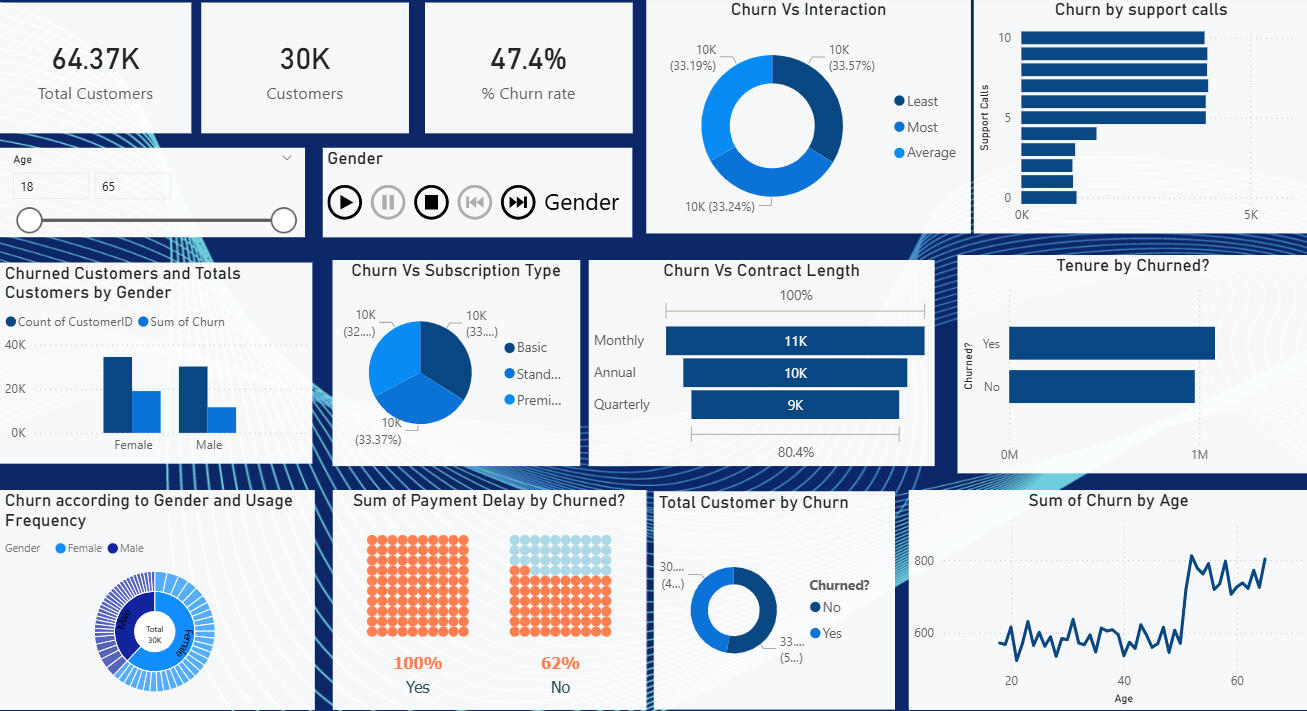
This project analyzes customer churn using Power BI and Power Query to uncover patterns and key risk factors affecting retention. The dashboard provides insights into support calls, service usage, and customer behavior, showing that service quality and overall customer experience are the strongest predictors of churn. These findings help identify at-risk customers and guide strategies to improve retention..
Financial report

This project analyzes customer complaints across financial products to identify patterns that inform advisor workforce planning. By examining complaint volume and trends, the analysis helps determine where additional advisors are needed and where staffing levels can be optimized.
The project focuses on transforming customer feedback into data-driven insights that support operational and strategic decision-making. An interactive dashboard is used to visualize complaint trends and advisor demand across products.